Feature tour

Features built for application-aware intrusion detection.

Educate buyers fast: IntrusionDetector.ai monitors live web and API activity, enriches it with application context, scores risk, groups alerts, and gives teams the evidence they need to investigate suspicious behavior.

Real-time Threat detection
AI-driven Attack classification
Instant Actionable alerts
Alert-only Adopt without breaking users

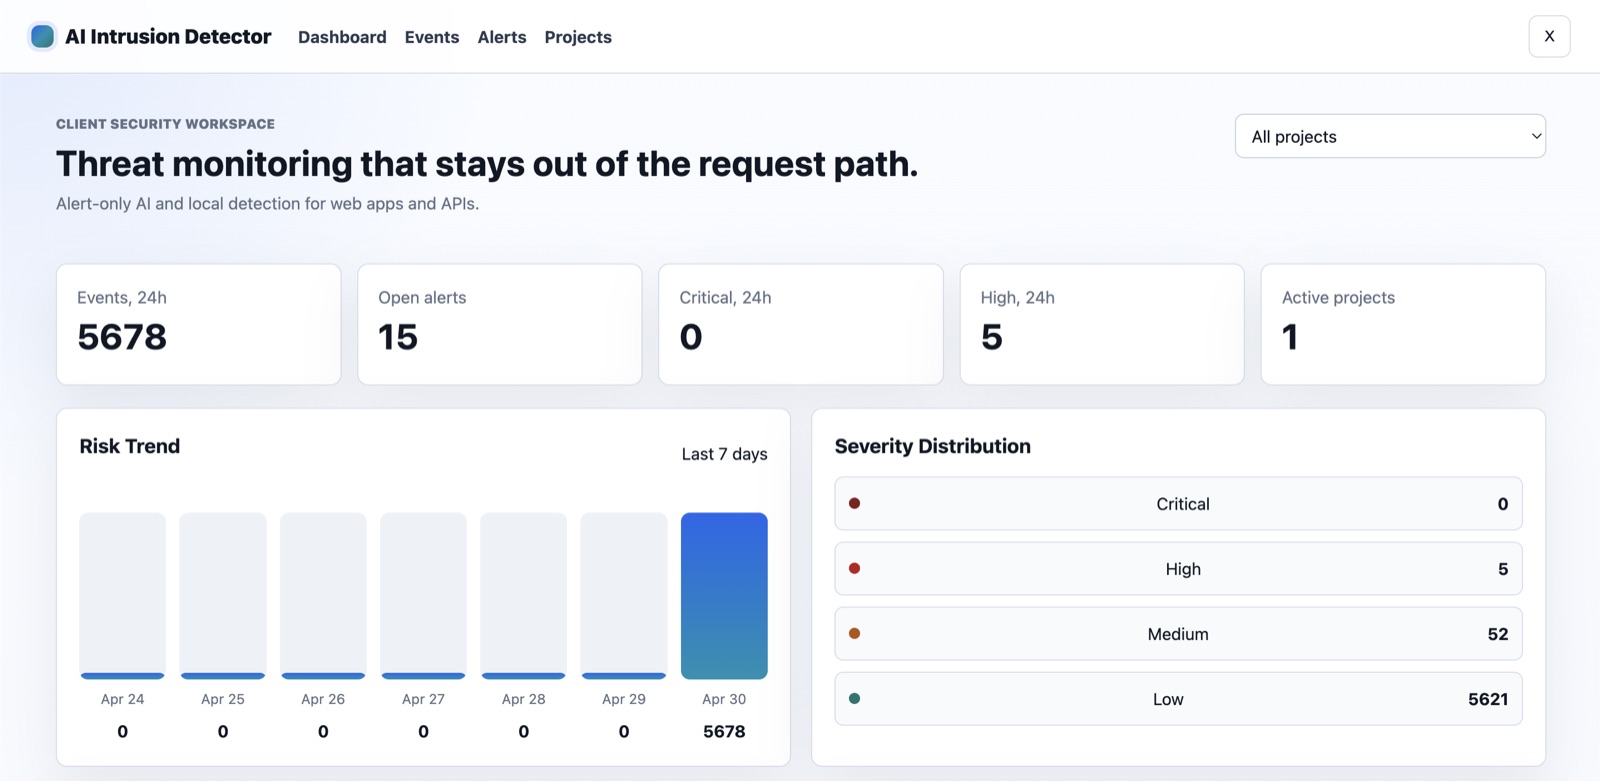
Dashboard

Workspace-level threat monitoring.

Monitor 24-hour volume, open alerts, critical and high events, active projects, risk trend, and severity distribution from the first screen.

  • Project-scoped filtering
  • Severity distribution by critical, high, medium, and low
  • Visual trend for sudden request spikes
Dashboard
Dashboard showing risk trend and severity distribution

Event stream

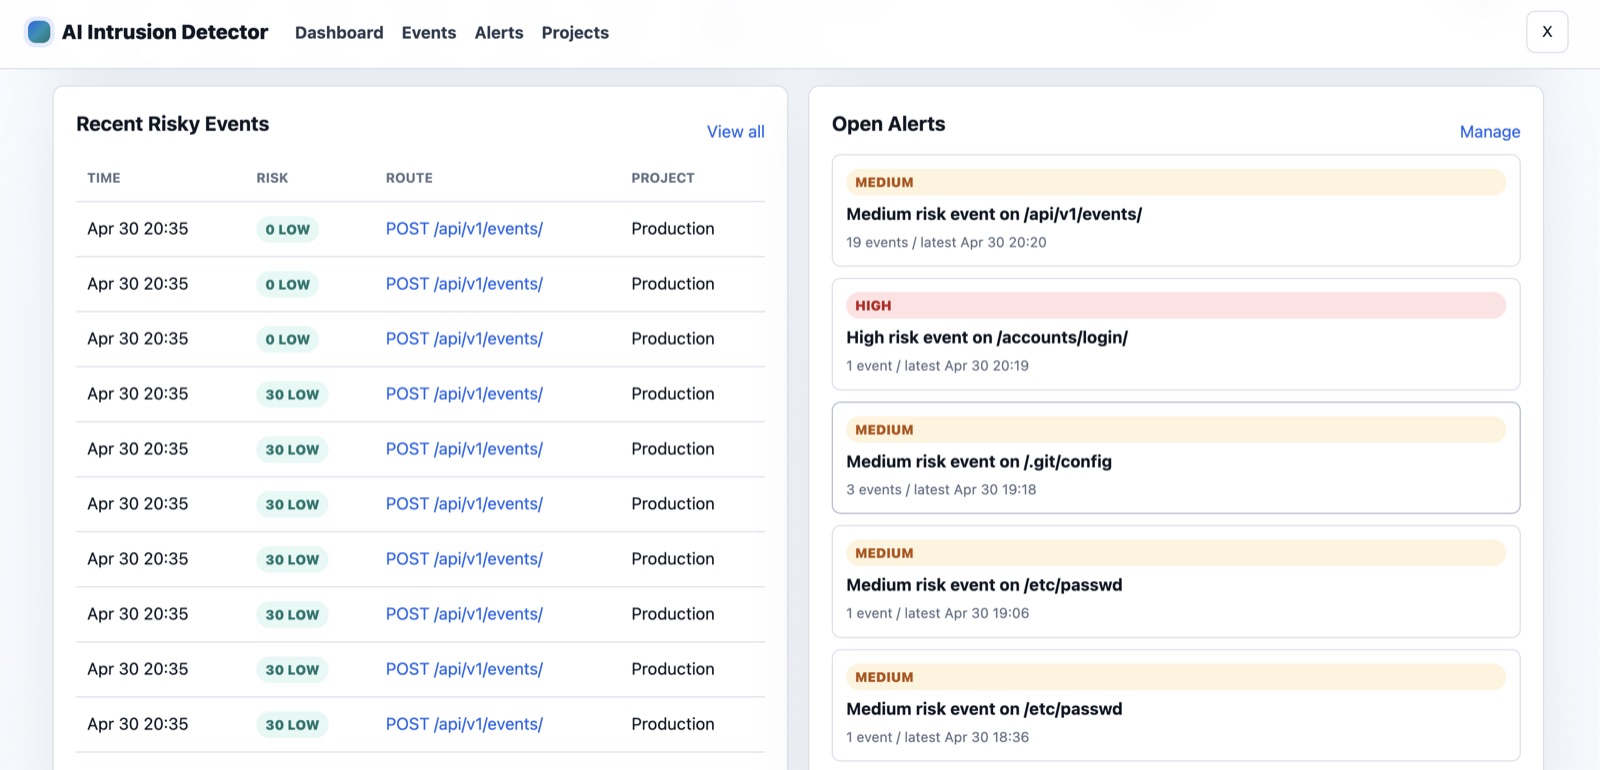
Recent risky events next to open alerts.

The event stream keeps useful raw context close to alert operations, so operators can compare repeated routes, risk labels, timing, and project source.

  • Route, risk, time, and project columns
  • Open alerts with latest-seen timestamps
  • Medium and high severity summaries
Events
Recent risky events and open alerts

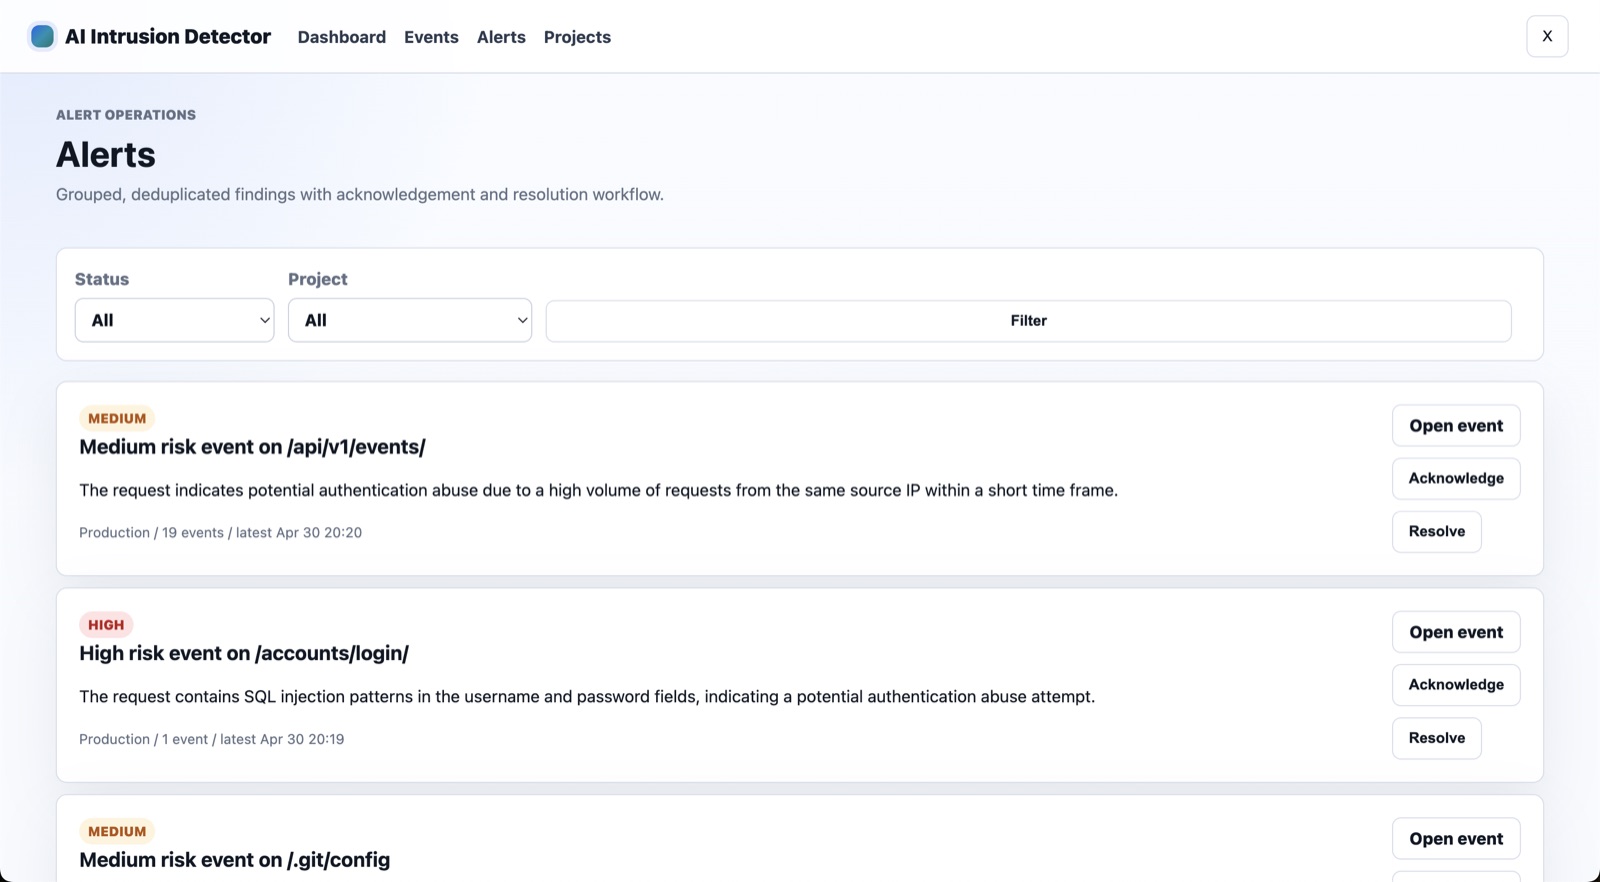
Alert operations

Grouped findings with acknowledgement and resolution.

Alerts are built around decisions. Open the event, acknowledge the finding, or resolve it once the team has handled the risk.

  • Status and project filters
  • Human-readable risk summary
  • Actions for open, acknowledge, and resolve
Alerts
Alerts operations page with action buttons

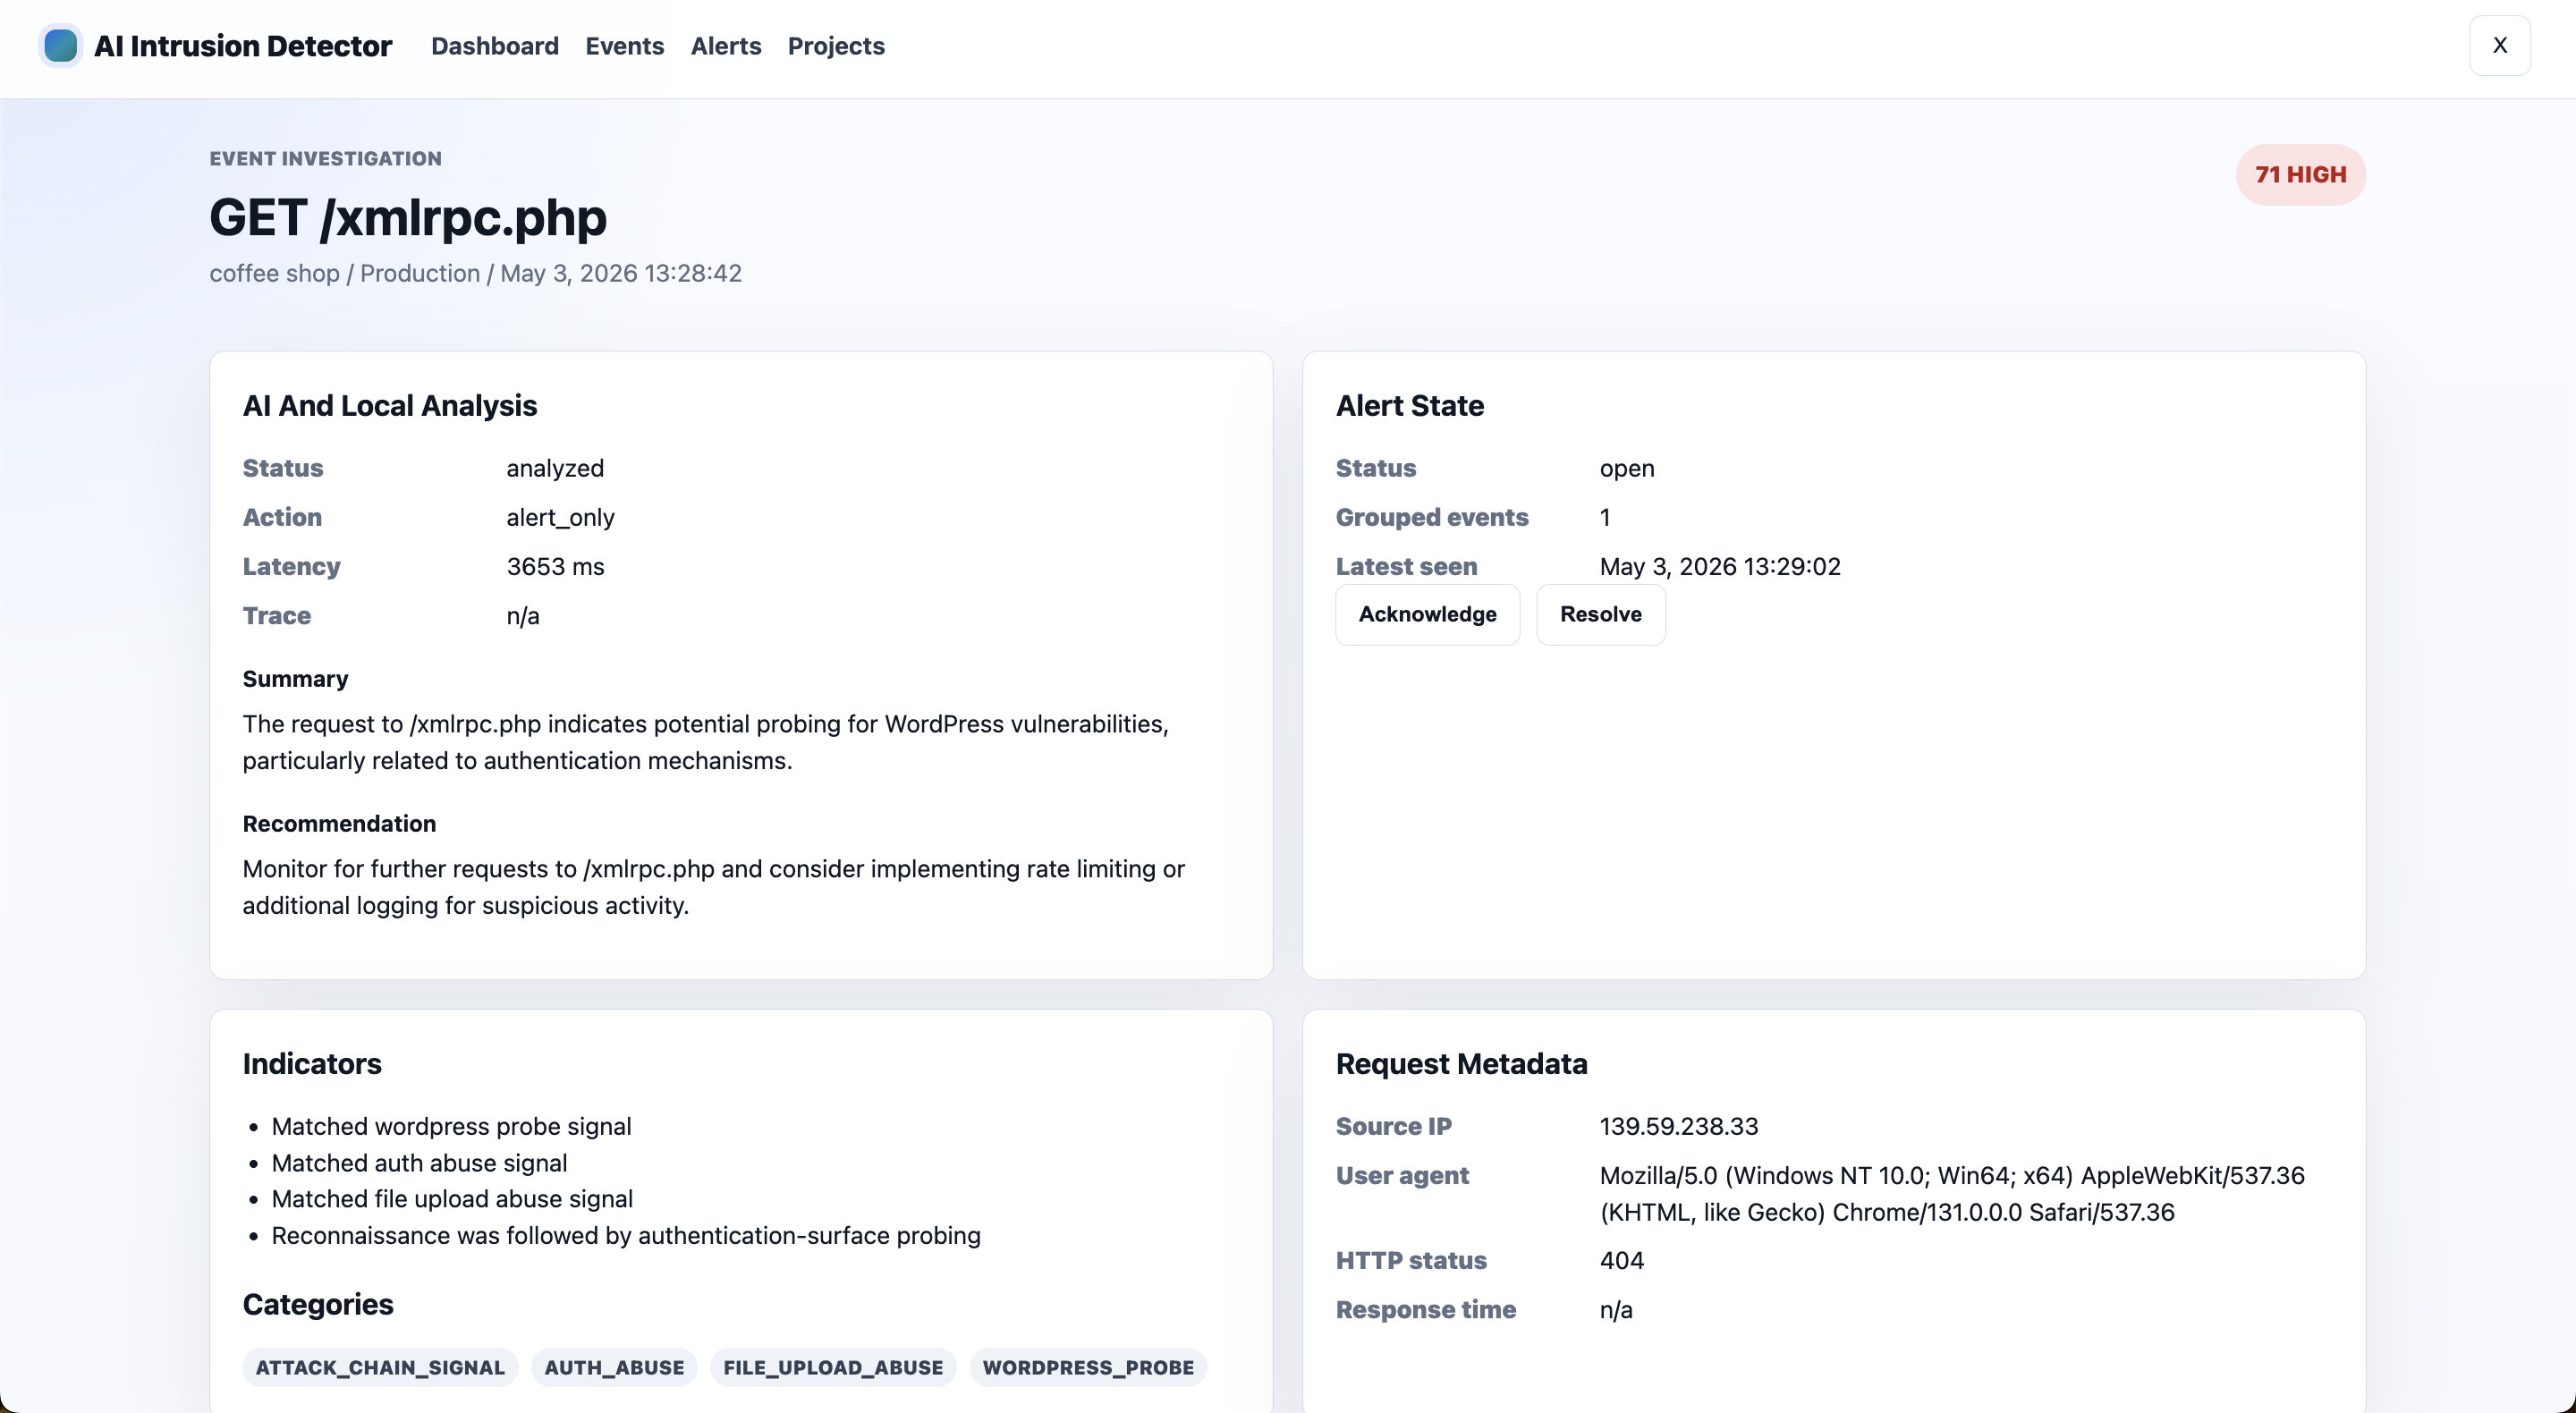
Investigation

AI and local analysis in one event record.

Each high-risk event records the action, model, latency, trace status, explanation, recommendation, grouped count, and current alert state.

  • SQL injection and auth abuse summaries
  • Alert state and latest-seen metadata
  • Fast handoff from triage to investigation
Investigation
Investigation detail for POST accounts login

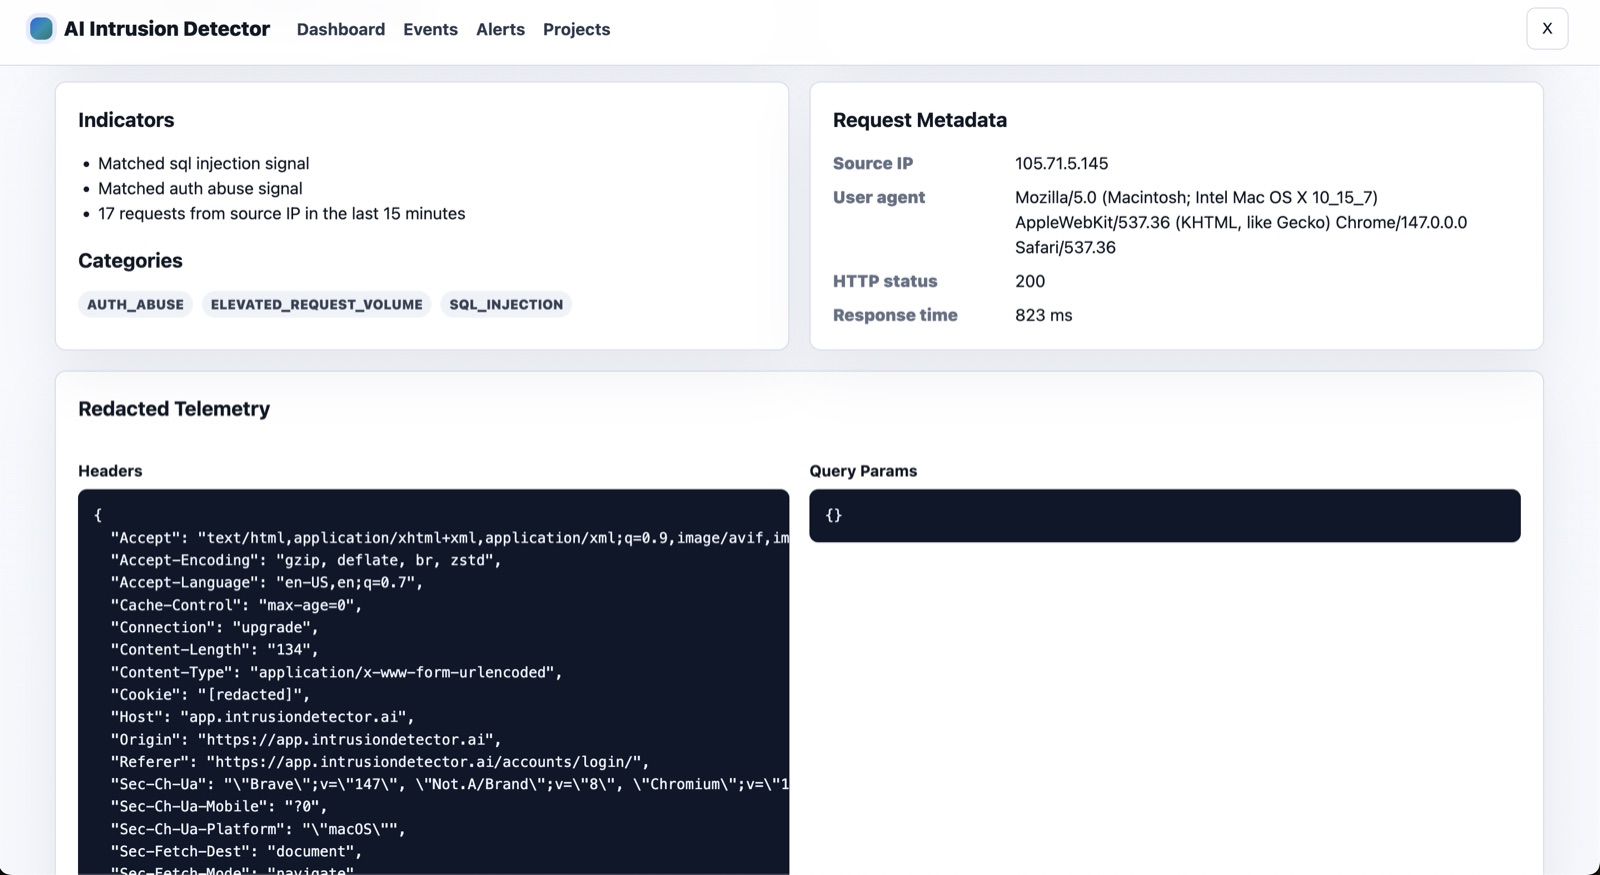
Telemetry

Evidence with redaction built into the experience.

Operators get the indicators, categories, request metadata, headers, and query parameters they need while sensitive fields stay hidden.

  • AUTH_ABUSE
  • SQL_INJECTION
  • REDACTED_HEADERS
Telemetry
Redacted telemetry and request metadata

Core platform features

Everything needed to turn runtime activity into useful security decisions.

This is not another pretty log viewer. The value is in application context, risk scoring, grouping, and investigation workflow.

Real-time web and API monitoring

Track routes, IPs, user agents, methods, query parameters, statuses, latency, services, environments, and client projects.

Multi-tenant SaaS dashboard

Each client sees only their own data while platform admins manage clients, projects, API keys, events, alerts, suppression rules, approvals, and audit logs.

Secure client approval

Clients can register, but they cannot access dashboards or generate API keys until an admin approves them.

Hashed API keys

Keys are shown only once during generation. The platform stores hashed keys plus a short prefix, and clients can rotate or revoke keys.

Local detection engine

Detect common attack patterns immediately even when optional AI enrichment is disabled, delayed, or unavailable.

Optional AI enrichment

AI can add summaries, risk explanations, investigation steps, category refinement, and human-readable recommendations asynchronously.

Risk scoring

Score events using attack patterns, behavior, history, response status, endpoint sensitivity, user and tenant context, object ownership, token/session signals, and frequency.

Alert deduplication and grouping

Repeated suspicious events become grouped alerts with severity, event count, first seen, latest seen, source IP, route, category, and grouping reason.

Suppression rules

Define ignored IPs, paths, user agents, and minimum risk thresholds while preserving suppressed events for visibility.

Application context

Find BOLA, IDOR, tenant leaks, and workflow abuse that network tools struggle to understand.

When your application sends metadata, the detector can reason about user ownership, tenant boundaries, denied authorization, object enumeration, suspicious workflows, and repeated access failures.

That matters because attackers often abuse valid routes and normal HTTP methods. Without context, the request looks boring. With context, it becomes evidence.

Example signal GET /api/orders/9281

User A requested an order owned by User B. The request was denied. The same session attempted multiple nearby object IDs. Risk category: BOLA / IDOR abuse.

Detection categories

Broad web, API, authentication, authorization, and bot coverage.

Injection

SQL injection, command injection, server-side template injection, code evaluation, malformed payload abuse.

XSS

Script tags, JavaScript URIs, event handlers, SVG indicators, iframe indicators, and cookie theft patterns.

File and path probing

Traversal, sensitive files, backup files, config files, database dumps, phpinfo, .env, and .git.

CMS and API recon

WordPress, Joomla, Drupal, Magento, Swagger, OpenAPI, GraphQL, private endpoints, and versioned API routes.

SSRF and cloud metadata

Localhost, internal IPs, AWS/GCP/Azure metadata, file URL abuse, and non-HTTP protocol indicators.

Auth and session abuse

Login probing, repeated failed logins, credential stuffing indicators, reset probing, token replay, and unusual session reuse.

Business logic abuse

BOLA, IDOR, cross-tenant access, object ownership mismatch, permission bypass, enumeration, and fraud-like behavior.

Scanner activity

SQLMap, Nikto, Nmap, Masscan, WPScan, Gobuster, Dirbuster, FFUF, Feroxbuster, Burp, route fan-out, and low-and-slow probing.
Integration model

Lightweight SDK, direct ingestion, asynchronous analysis, fail-open behavior.

Use it as a practical runtime security layer beside secure coding, WAFs, firewalls, code scanners, and cloud security tools.

1

Install

Add Django middleware, Flask integration, a manual Python client, direct HTTP ingestion, or a custom connector.

2

Send context

Send safe request telemetry plus optional user, tenant, object, permission, token, session, and ownership metadata.

3

Investigate

Review trends, events, open alerts, AI summaries, indicators, recommendations, and grouped alert history.

Ready to integrate

Start with alert-only monitoring, then tighten response rules with evidence.